| Annualized | |||||||
|---|---|---|---|---|---|---|---|
| YTD 2017 (SEP) |
1 Year 2016 |
3 Yrs 2014-2016 |
5 Yrs 2012-2016 |
10 Yrs 2007-2016 |
15 Yrs 2002-2016 |
20 Yrs 1997-2016 |
|
| Folio 80 | 10.96% | 12.32% | 4.93% | 10.42% | 5.58% | 8.87% | 8.87% |
| Benchmark Index | 10.43% | 11.97% | 5.16% | 10.04% | 5.12% | 8.05% | 7.89% |
| Annual | ||
|---|---|---|
| Folio 80 | Benchmark Index | |
| 1997* | 16.07% | 15.52% |
| 1998* | 7.63% | 7.74% |
| 1999* | 15.04% | 12.36% |
| 2000* | 4.71% | 2.95% |
| 2001* | 1.64% | -0.61% |
| 2002* | -5.38% | -7.34% |
| 2003* | 38.06% | 33.83% |
| 2004* | 19.56% | 18.00% |
| 2005* | 10.38% | 9.64% |
| 2006* | 20.56% | 20.86% |
| 2007 | 3.49% | 3.73% |
| 2008 | -32.36% | -30.22% |
| 2009 | 34.00% | 27.84% |
| 2010 | 17.60% | 14.89% |
| 2011 | -4.95% | -3.95% |
| 2012 | 15.79% | 15.24% |
| 2013 | 22.68% | 20.41% |
| 2014 | 5.24% | 6.14% |
| 2015 | -2.26% | -2.15% |
| 2016 | 12.32% | 11.97% |
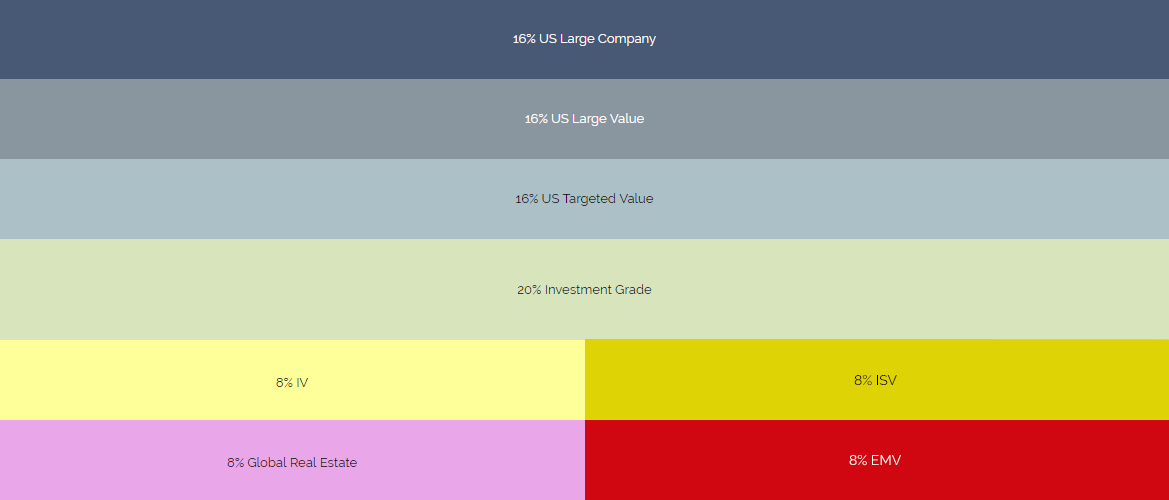
| Benchmark Index | |
|---|---|
| S&P 500 Index | 16.00% |
| Russell 1000 Value Index | 16.00% |
| Russell 2000 Value Index | 16.00% |
| Dow Jones U.S. REIT Index | 4.00% |
| MSCI EAFE Value Index | 8.00% |
| MSCI EAFE Small Value Index | 8.00% |
| S&P Global ex US REIT Index | 4.00% |
| MSCI Emerging Markets Value Index | 8.00% |
| Barclays Capital U.S. Aggregate Bond Index | 20.00% |
| Folio 80 | Benchmark Index | |
|---|---|---|
| Mean Return | 9.99% | 8.84% |
| Median Return | 11.35% | 10.81% |
| Worst Return | -32.36% | ‐30.22% |
| Best Return | 38.06% | 33.83% |
| Negative Returns | 4 | 5 |

