Active Strategies
Attempts to pick “winning” stocks
Generates higher expenses, trading costs and risks
Relies on forecasting to select “undervalued” securities
Times markets
Our Approach
Passive strategy adding value by portfolio design
Cost-effective
Structures (tilts) portfolios to emphasize areas of higher expected returns
Reduces volatility via Fixed Income
Past performance is no guarantee of future results. Survivors are funds that were still in existence as of December 31, 2015. Outperformers are survivors that beat their respective benchmarks over the period. US-domiciled mutual fund data is from the CRSP Survivor-Bias-Free US Mutual Fund Database, provided by the Center for Research in Security Prices, University of Chicago.
Clients trust our transparent, consistent investment approach.
MARKET PRICING EFFICIENCY
PORTFOLIO DESIGN MATTERS
Millions of participants buy and sell securities in the world markets every day.
The new information buyers and sellers bring to the markets help set prices—and with each bit of new information, prices adjust accordingly.
If you do not believe that market prices are good estimates, you are pitting your knowledge or hunches against the combined knowledge of thousands or millions of other market participants.
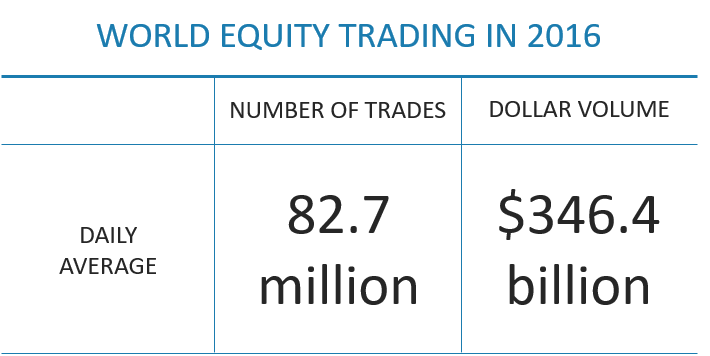
In US dollars. Source: World Federation of Exchanges members, affiliates, correspondents and non-members. Trade data from the global electronic order book. Daily averages were computed using year-to-date totals as of December 31, 2016, divided by 250 as an approximate number of annual trading days.
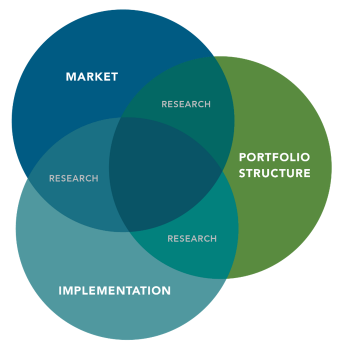
Our investment philosophy is based on the power of market prices and guided by theoretical and empirical research.
An integrated portfolio design process adds value at each step. Research can be applied throughout the process for an advanced understanding of all aspects of investing.
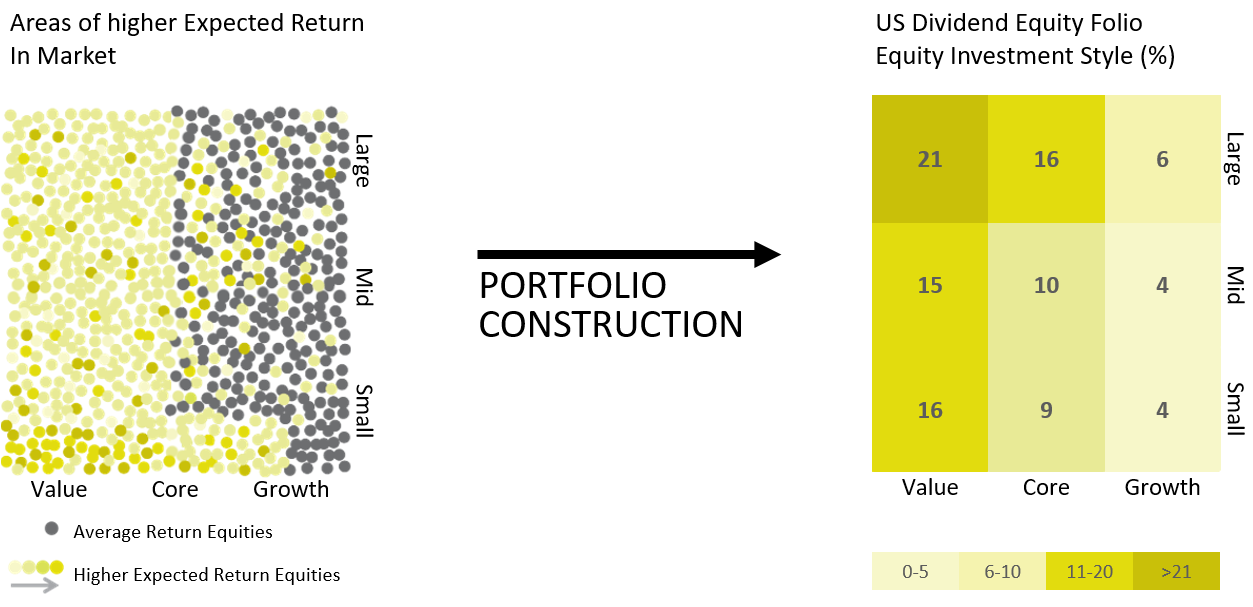
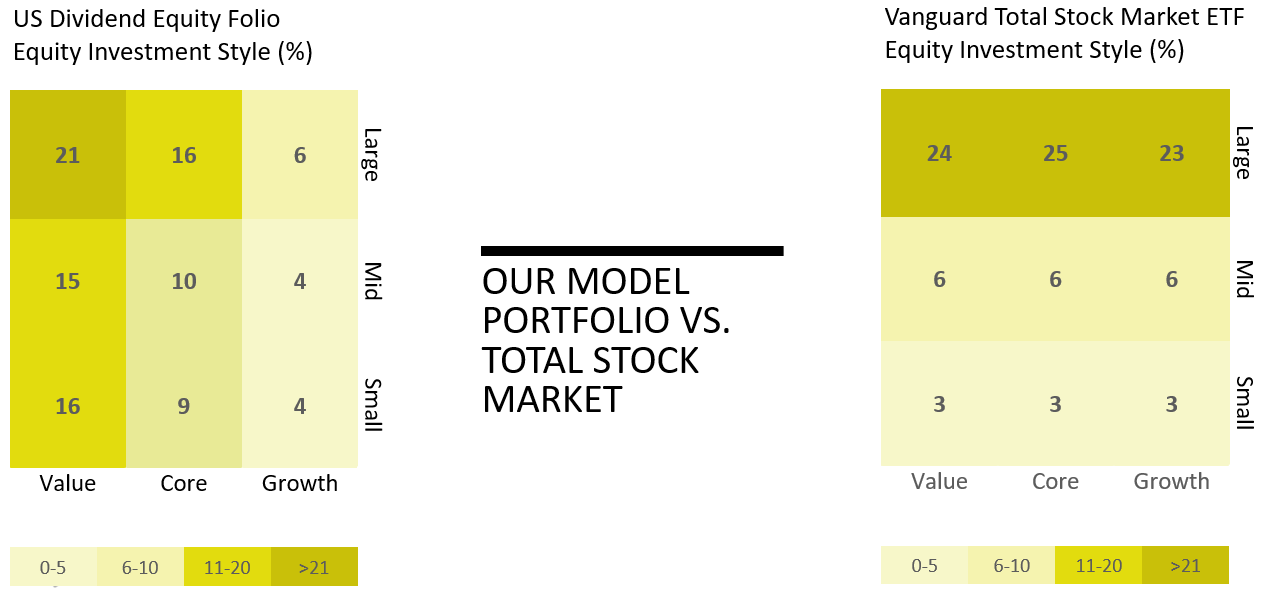
Decades of academic research and rigorous testing have identified areas in the market that have provided higher returns consistently such as: equities with low relative prices (value stocks) and/or relatively small market capitalization (small or mid-cap stocks).
Within well-diversified portfolios, we overweight these areas of higher expected return potential.
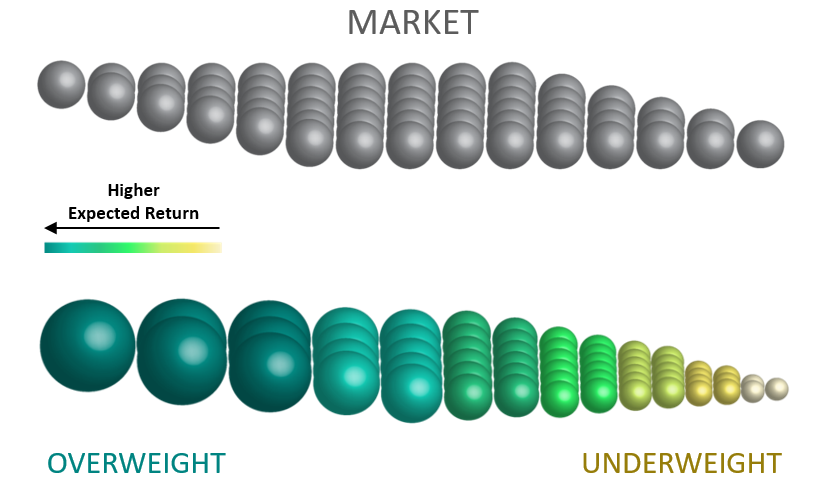
We construct portfolios to purse higher expected returns through a low-cost, well-diversified portfolio.
When equity markets experience a bear market, there typically tends to be a “flight to safety.” Money will migrate to Fixed Income, specifically US Treasuries.
Below is a chart that shows every year the S&P 500 posted negative returns since 1926 and the respective performance of the Intermediate US Treasury Index.
| Year | S&P 500 Return (%) | Interm. US Treasury Return (%) |
|---|---|---|
| 1929 | -8.42 | 6.01 |
| 1930 | -24.90 | 6.72 |
| 1931 | -43.34 | -2.32 |
| 1932 | -8.19 | 8.81 |
| 1934 | -1.44 | 9.00 |
| 1937 | -35.03 | 1.56 |
| 1939 | -0.41 | 4.52 |
| 1940 | -9.78 | 2.96 |
| 1941 | -11.59 | 0.5 |
| 1946 | -8.07 | 1.00 |
| 1953 | -0.99 | 3.23 |
| 1957 | -10.78 | 7.84 |
| 1962 | -8.73 | 5.56 |
| 1966 | -10.06 | 4.69 |
| 1969 | -8.50 | -0.74 |
| 1973 | -14.69 | 4.61 |
| 1974 | -26.47 | 5.69 |
| 1977 | -7.16 | 1.41 |
| 1981 | -4.92 | 9.45 |
| 1990 | -3.10 | 9.73 |
| 2000 | -9.10 | 12.59 |
| 2001 | -11.89 | 7.62 |
| 2002 | -22.10 | 12.93 |
| 2008 | -37.00 | 13.11 |
