| Annualized | |||||||
|---|---|---|---|---|---|---|---|
| YTD 2017 (SEP) |
1 Year 2016 |
3 Yrs 2014-2016 |
5 Yrs 2012-2016 |
10 Yrs 2007-2016 |
15 Yrs 2002-2016 |
20 Yrs 1997-2016 |
|
| Folio 50 | 7.60% | 8.13% | 3.51% | 6.90% | 4.96% | 7.12% | 7.21% |
| Benchmark Index | 7.25% | 7.91% | 3.65% | 6.69% | 4.49% | 6.37% | 6.57% |
| Annual | ||
|---|---|---|
| Folio 50 | Benchmark Index | |
| 1997* | 11.34% | 12.29% |
| 1998* | 8.24% | 7.70% |
| 1999* | 9.91% | 8.91% |
| 2000* | 4.90% | 4.93% |
| 2001* | 3.35% | 2.38% |
| 2002* | -0.41% | -2.47% |
| 2003* | 25.11% | 21.87% |
| 2004* | 13.10% | 11.89% |
| 2005* | 7.13% | 6.87% |
| 2006* | 14.46% | 14.55% |
| 2007 | 4.15% | 4.94% |
| 2008 | -18.77% | -16.30% |
| 2009 | 24.55% | 17.51% |
| 2010 | 12.55% | 10.19% |
| 2011 | -2.00% | -1.65% |
| 2012 | 10.29% | 9.97% |
| 2013 | 14.17% | 12.90% |
| 2014 | 3.72% | 4.28% |
| 2015 | -1.13% | -1.05% |
| 2016 | 8.13% | 7.91% |
| Benchmark Index | |
|---|---|
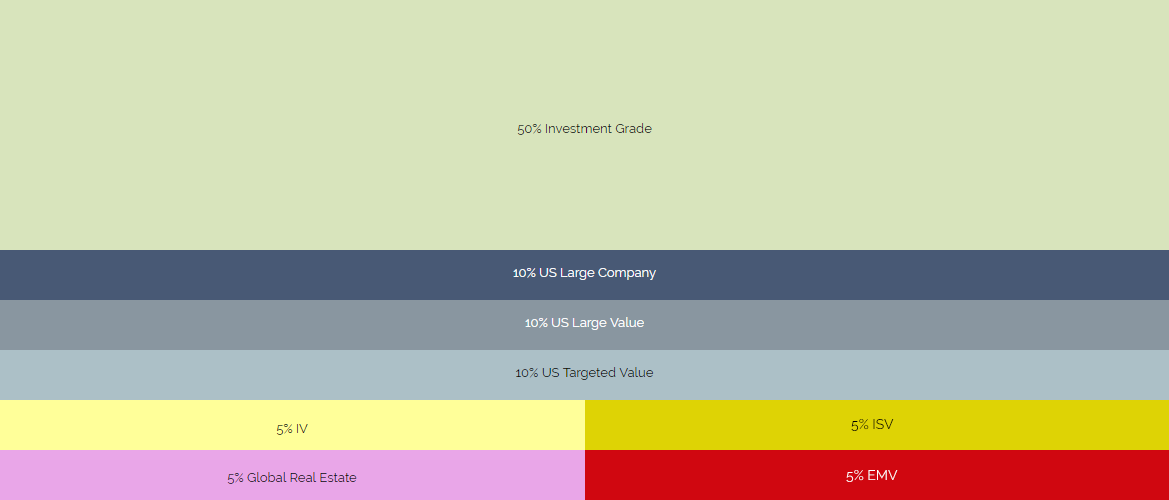
| S&P 500 Index | 10.00% |
| Russell 1000 Value Index | 10.00% |
| Russell 2000 Value Index | 10.00% |
| Dow Jones U.S. REIT Index | 2.50% |
| MSCI EAFE Value Index | 5.00% |
| MSCI EAFE Small Value Index | 5.00% |
| S&P Global ex US REIT Index | 2.50% |
| MSCI Emerging Markets Value Index | 5.00% |
| Barclays Capital U.S. Aggregate Bond Index | 50.00% |
| Folio 50 | Benchmark Index | |
|---|---|---|
| Mean Return | 7.64% | 6.88% |
| Median Return | 8.19% | 7.81% |
| Worst Return | -18.77% | -16.30% |
| Best Return | 25.11% | 21.87% |
| Negative Returns | 4 | 4 |

