


We’ll take a quantitative approach to pinpointing your Risk Number by going through a series of objective exercises based on actual dollar amounts.

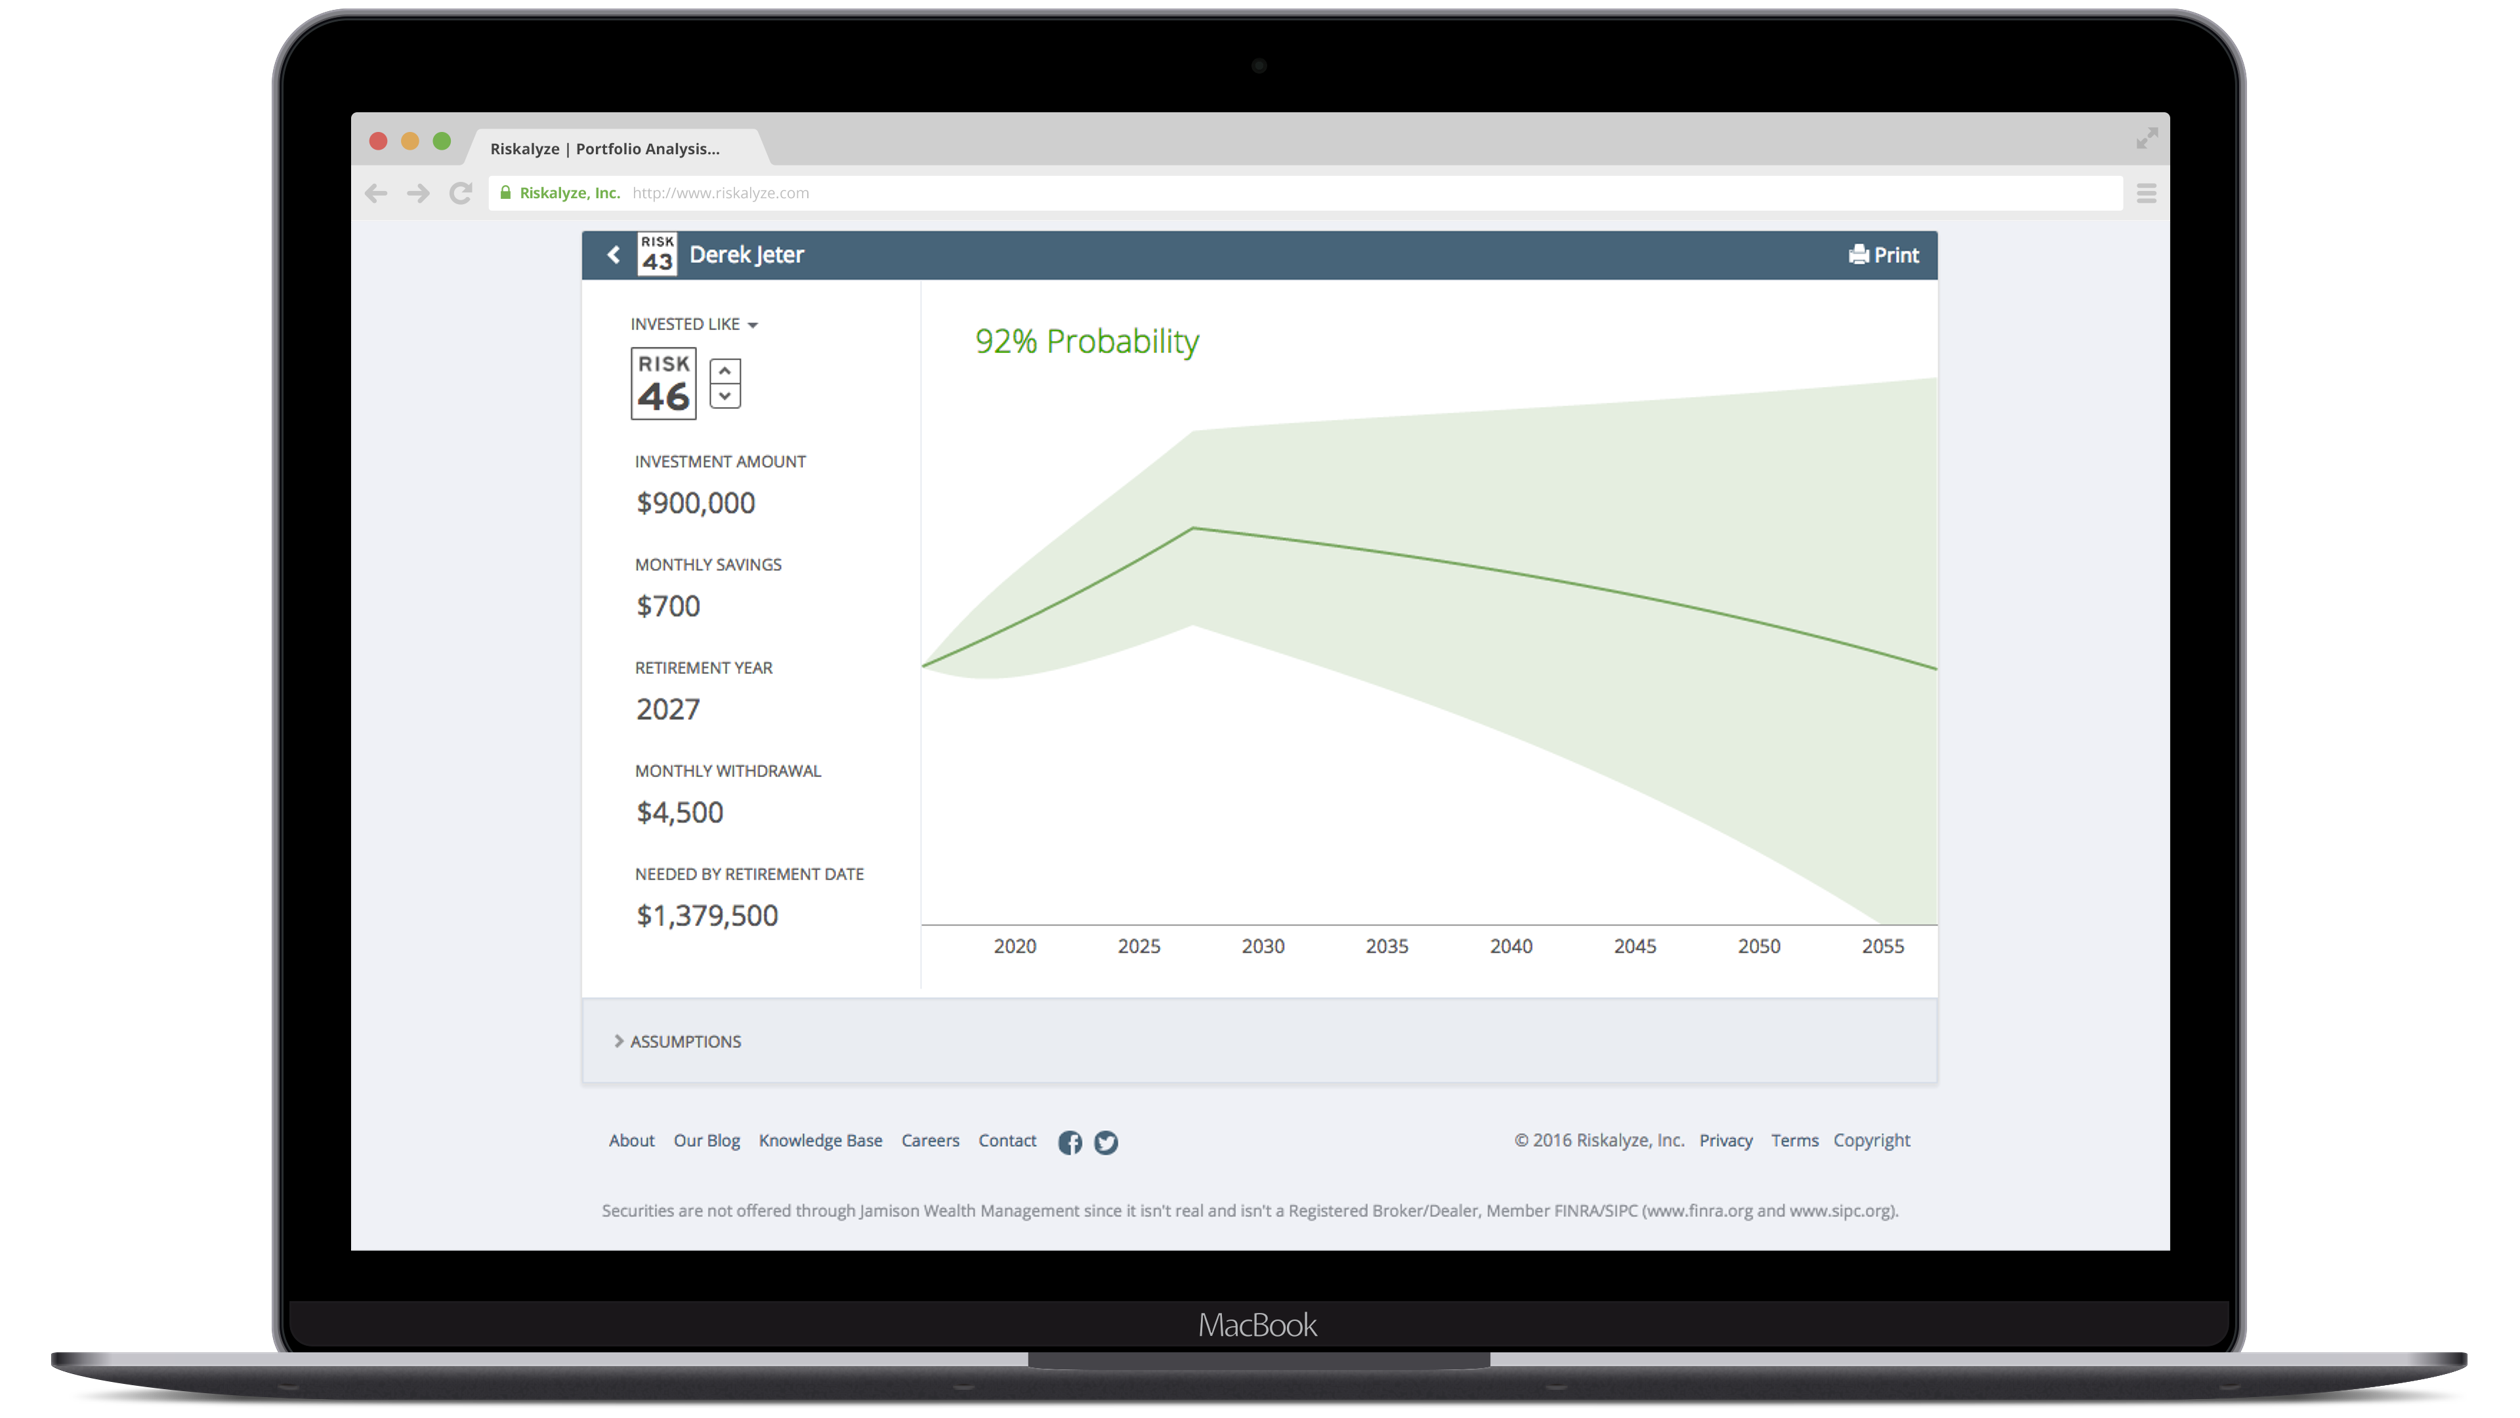
We can chart a path to retirement using a simple, intuitive approach on our Retirement Map Report. We’ll visualize the probability of a successful retirement and adjust in realtime.
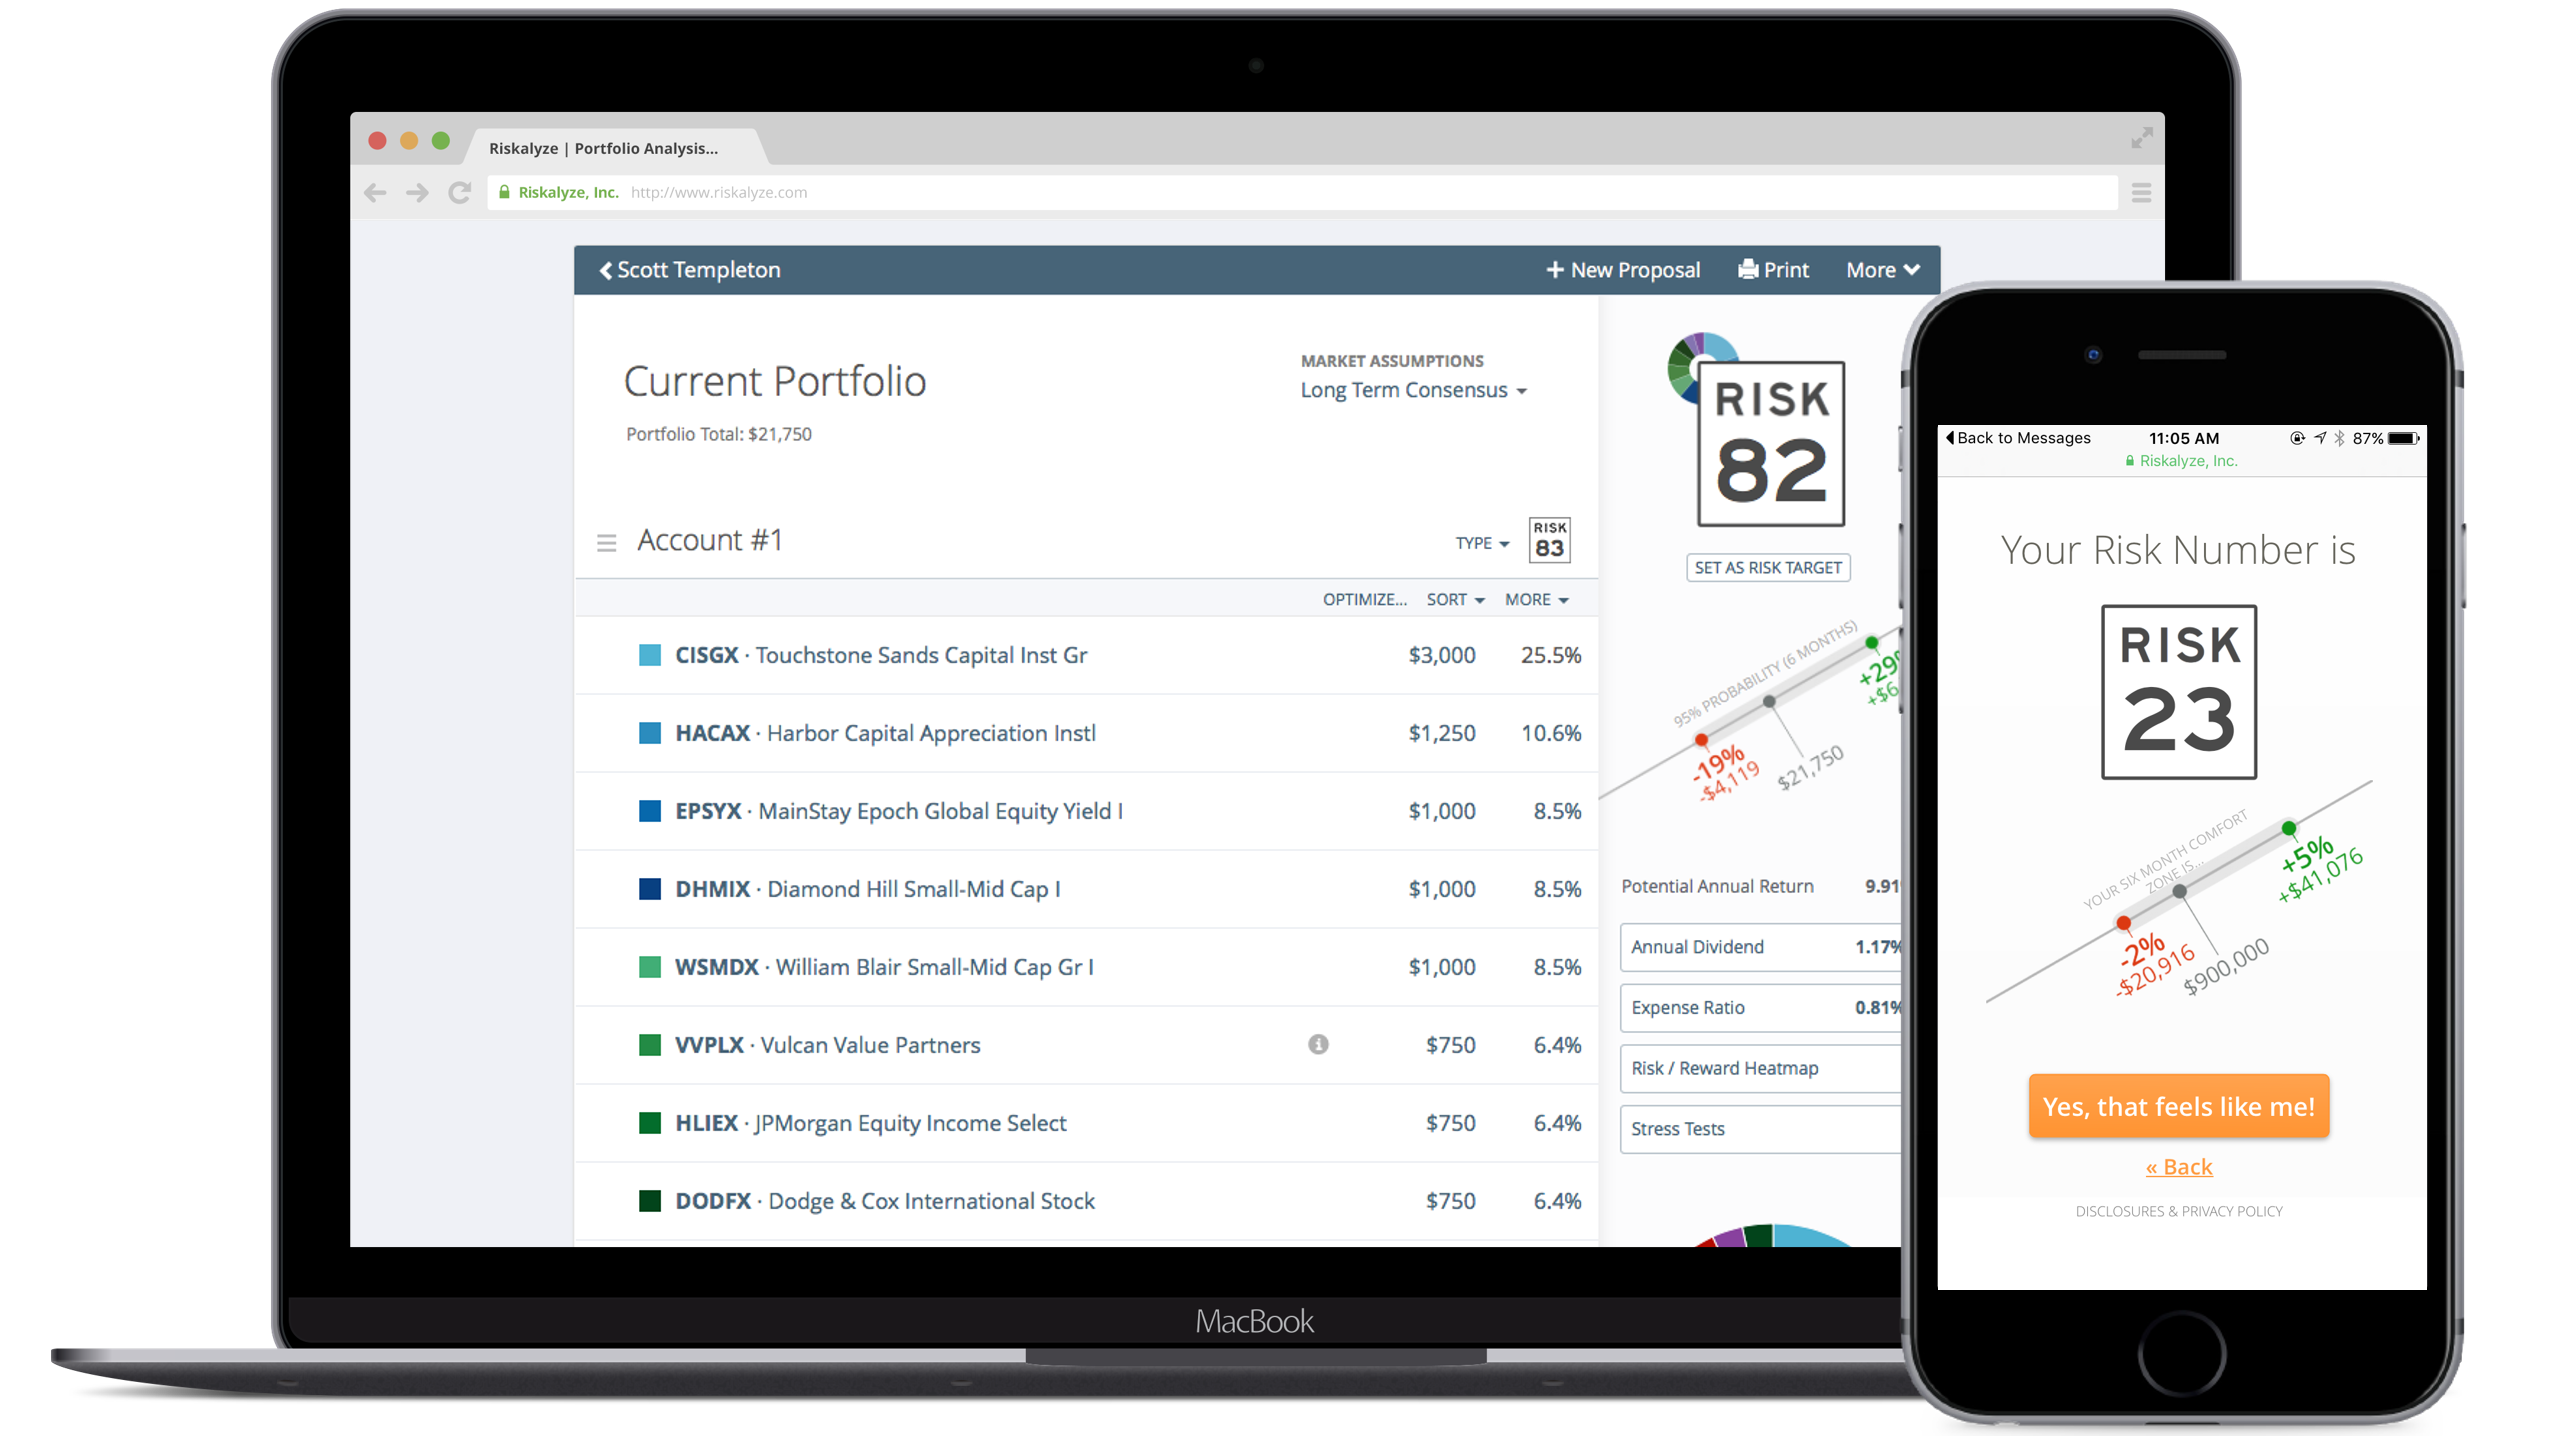
If you’ve already got an investment portfolio, we can quickly import it and see if your Risk Number aligns with your current amount of Risk.

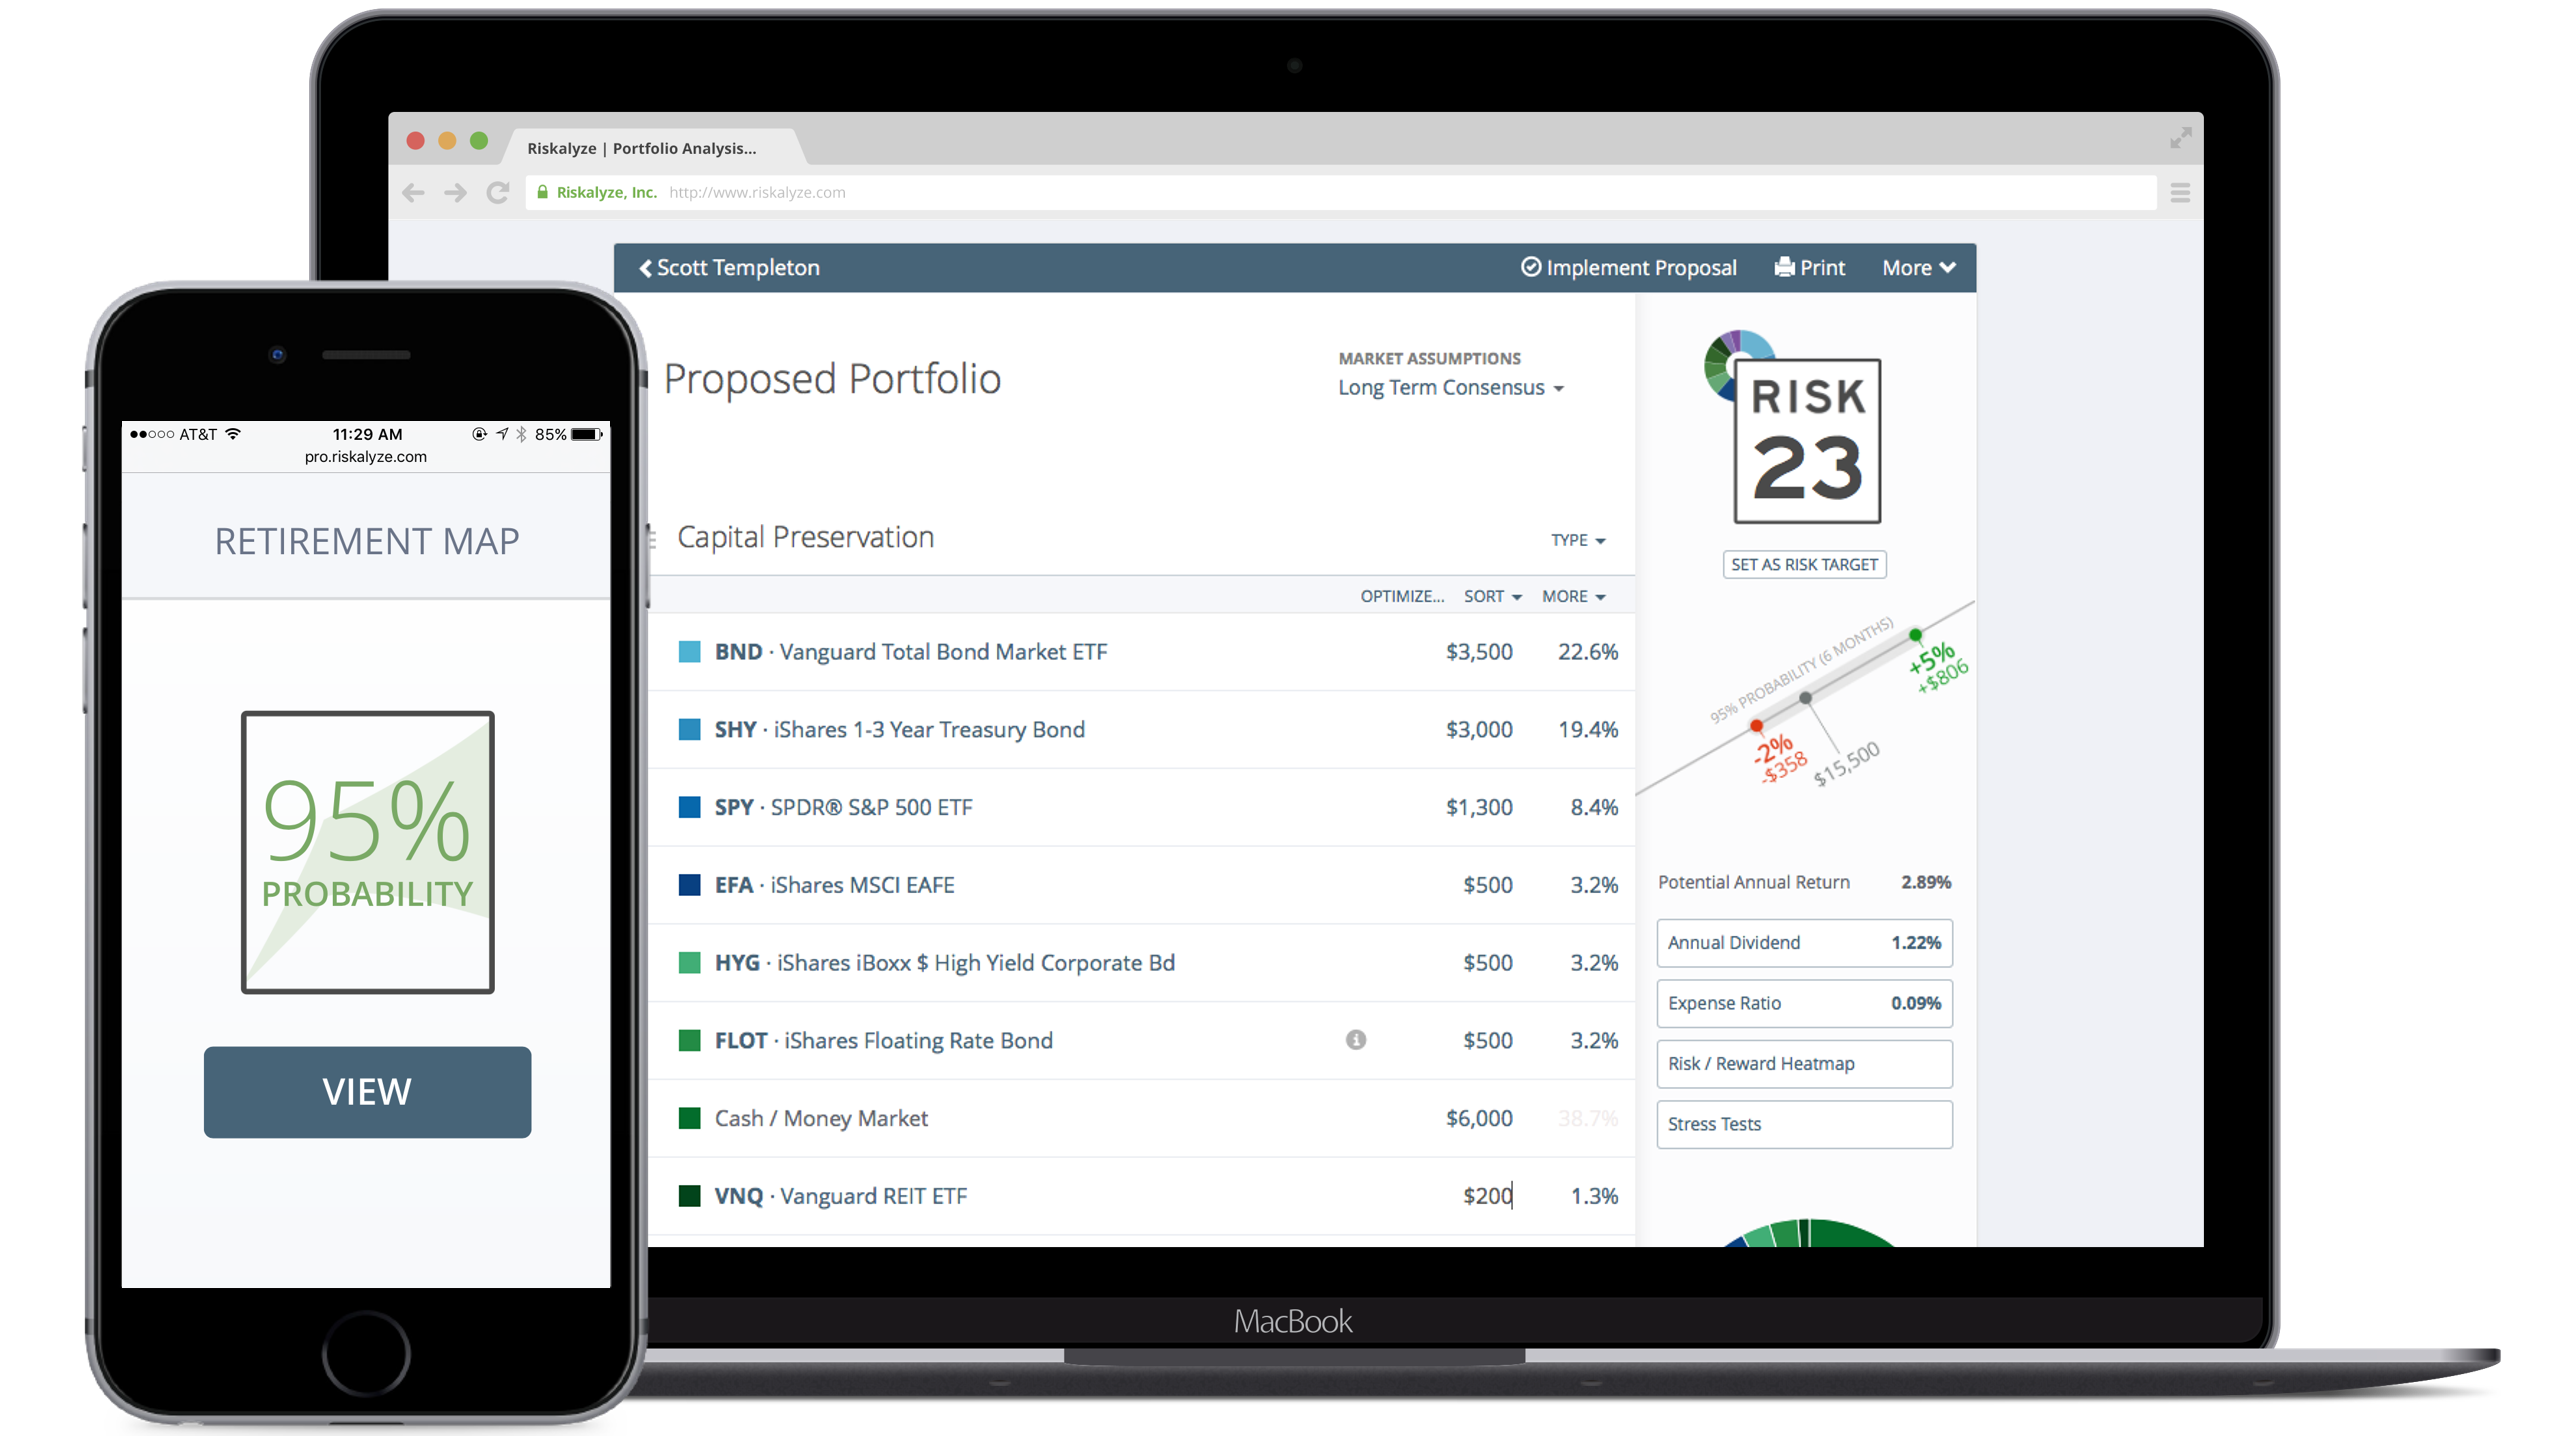
We’ll use all these factors to build an optimized portfolio that fits your risk tolerance and goals. We can then stress test your new portfolio, discuss your 95% probability range, and set expectations for the future!
The Risk Number is an objective, mathematical approach to removing subjectivity by quantifying the risk of investors and portfolios. The Risk Number is calculated based on downside risk. On a scale from 1 of 99, the greater the potential loss, the greater the Risk Number.
We believe investing is broken. Ambiguous terms such as “conservative” or “moderately-aggressive” cause confusion in the investment arena. This uncertainty benefits no one in the advisor-client relationship.
Generalizing client risk tolerance doesn’t work. Investors view risk through their own, unique lens to gauge risk and return tradeoffs. The speed limit metaphor helps instill an understanding of that risk. Sometimes it’s prudent to slow down depending on weather conditions—the same is true of risk.
The Risk Number is a proprietary scaled index developed by Riskalyze to reflect a risk score for both an investor’s unique fingerprint or for a particular portfolio of investments. Shaped like a speed limit sign, a higher Risk Number means a higher level of risk and potential return.
The Risk Number is a single-dimension variable designed to approximate the relative risk between people or portfolios. Thus, a “45” portfolio generally has more risk than a “44,” but two “45” portfolios may be quite different from each other.
One of the most important drivers of the Risk Number is the measurement of downside risk: either the downside risk in the investor’s comfort zone (the range of risk to reward that they approve via risk questionnaire), or the downside risk in a portfolio as measured by the 95% probability range.
Here are a few examples of the relationship between downside risk and Risk Number:
- Downside of -2%: Low 20s
- Downside of -5%: Low 30s
- Downside of -7%: Low 40s
- Downside of -12%: Low 60s
- Downside of -18%: Low 80s
A Six Month Probability Range is calculated in every portfolio. Each portfolio has a 95% mathematical probability of ending up within that range six months from today. Riskalyze cannot predict where a portfolio might end up inside of the range, and there is a 5% probability it will end up outside of the range.
The underlying market assumptions for calculating the Six Month Probability Range is an important factor in this equation. Riskalyze’s technology is model-agnostic, but they needed to develop a solid and stable one that advisors could reliably use with clients. The results speak for themselves — for the $2 billion in portfolios built on this data model in 2012, less than 1.6% of portfolios broke below projected risk. This was despite the serious volatility in May 2012, or the high number of AAPL-heavy portfolios that dropped in value in the fall of 2012.
All investments are calculated using the actual past performance of their returns, standard deviation, and correlations. Riskalyze uses volatility and correlation statistics to calculate the width of the Six Month Probability Range and corresponding Risk Number. The standard deviation and correlation matrix gives Riskalyze the statistics needed to calculate the distance between the downside and upside returns in the 6 month range.
Specific to standard deviation, when securities newer than 1/1/2008 are presented, Riskalyze assists advisors in making apples-to-apples comparisons between younger and older securities by use of Extrapolation. Thus, Extrapolation mitigates a younger fund appearing out of harm’s way when it’s stacked next to a seasoned, veteran investment.
Here are a few examples of the relationship between downside risk and Risk Number:
- Downside of -2%: Low 20s
- Downside of -5%: Low 30s
- Downside of -7%: Low 40s
- Downside of -12%: Low 60s
- Downside of -18%: Low 80s